Similar to other functions, the Excel POISSON function when applied correctly will give accurate and fast results, helping you to know the function that returns the appropriate POISSON attribution. You can review the syntax and example below about the POISSON function.
The POISSON function returns the Poisson distribution. This computational function is applied in many practical problems such as to predict the number of events that occur in a certain known time. The Poisson distribution is also used for intervals that differ in units of time such as distance, area, or volume.

Excel POISSON function
How to Use the POISSON Function in Excel – Illustrative Example
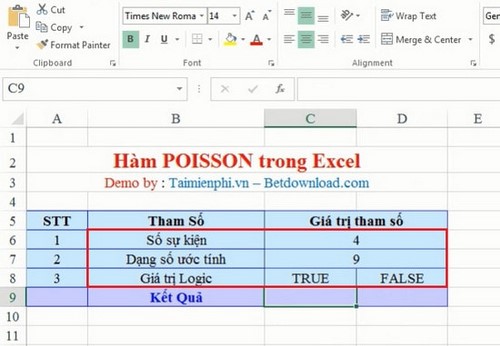
Syntax: POISSON(x, mean, cumulative)
Where:
– x: Required – Is the number of events.
– mean: Required – An estimated value in numerical form.
– cumulative: Required – A logical value that defines the format of the returned result.

Consider an example
Give the excel spreadsheet with actual values corresponding to the parameters of the POISSON function. In this example we calculate with the number of events as 4, the estimated number form is 9:
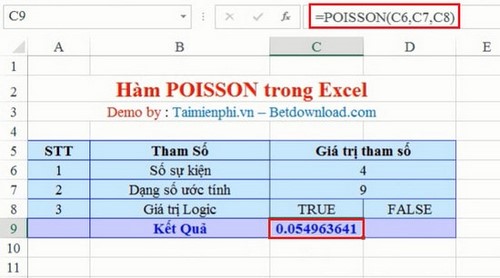
Enter the formula in cell C9. The calculated result of the function obtained is 0.054963641 with the logical value TRUE:
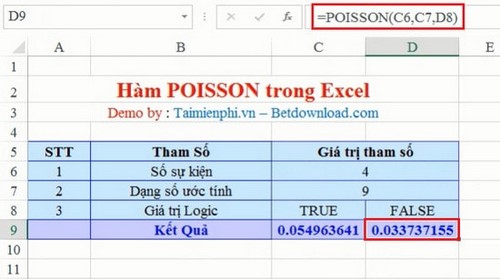
Enter the formula in cell D9. And the result is 0.033737155 with a logical value of FALSE :
https://thuthuat.taimienphi.vn/ham-poisson-trong-excel-2338n.aspx
So you already know how to use the POISSON function in Excel. This distribution, also known as the Poabath distribution, is a discrete probability distribution with information indicating the average number of successful occurrences of an event over a given period of time.